
When performing my analysis and graphing for my previous post I ran into a problem of identifying and displaying missing time series data. From a series of data that occurs daily, I wanted to identify if there were missing days, and to graph them so that they can easily be seen.
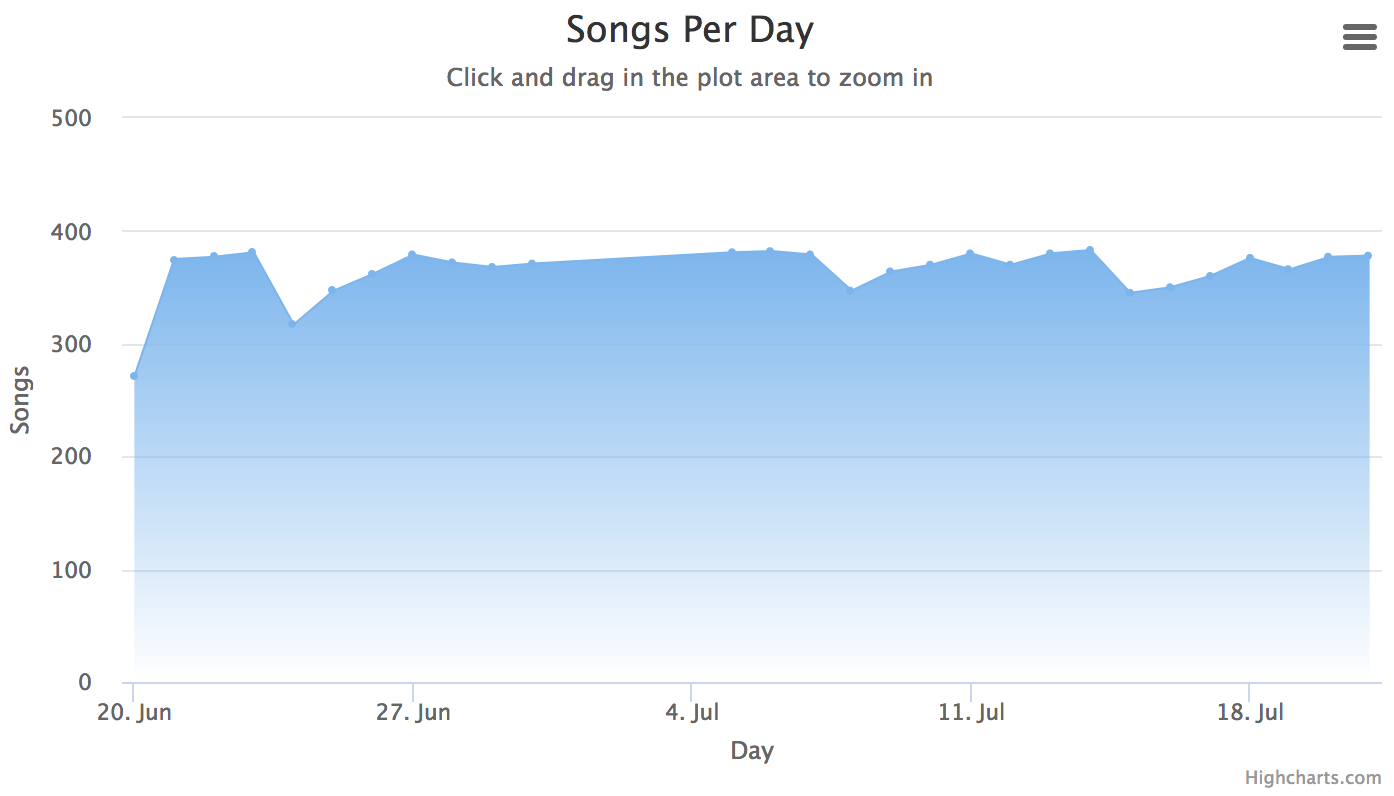
By default, when Highcharts plots time series data and there are missing points along the x-axis, the graph is still connected between the last two available points. Since we do not even know if any data is missing in the first place, this makes it difficult to identify a gap in a larger dataset–especially if the two values are close to each other. I prefer to see the missing data as if the value on the y-axis is 0. There are several ways to approach this, one of which might be to tinker with Highcharts and write some custom JavaScript when creating the chart, but at this stage I wanted to avoid it. Making sure that missing data is represented in my resulting dataset meant that plotting it in Highchars became trivial, as well as made it easier down the line if I wanted to use a different graphing library.
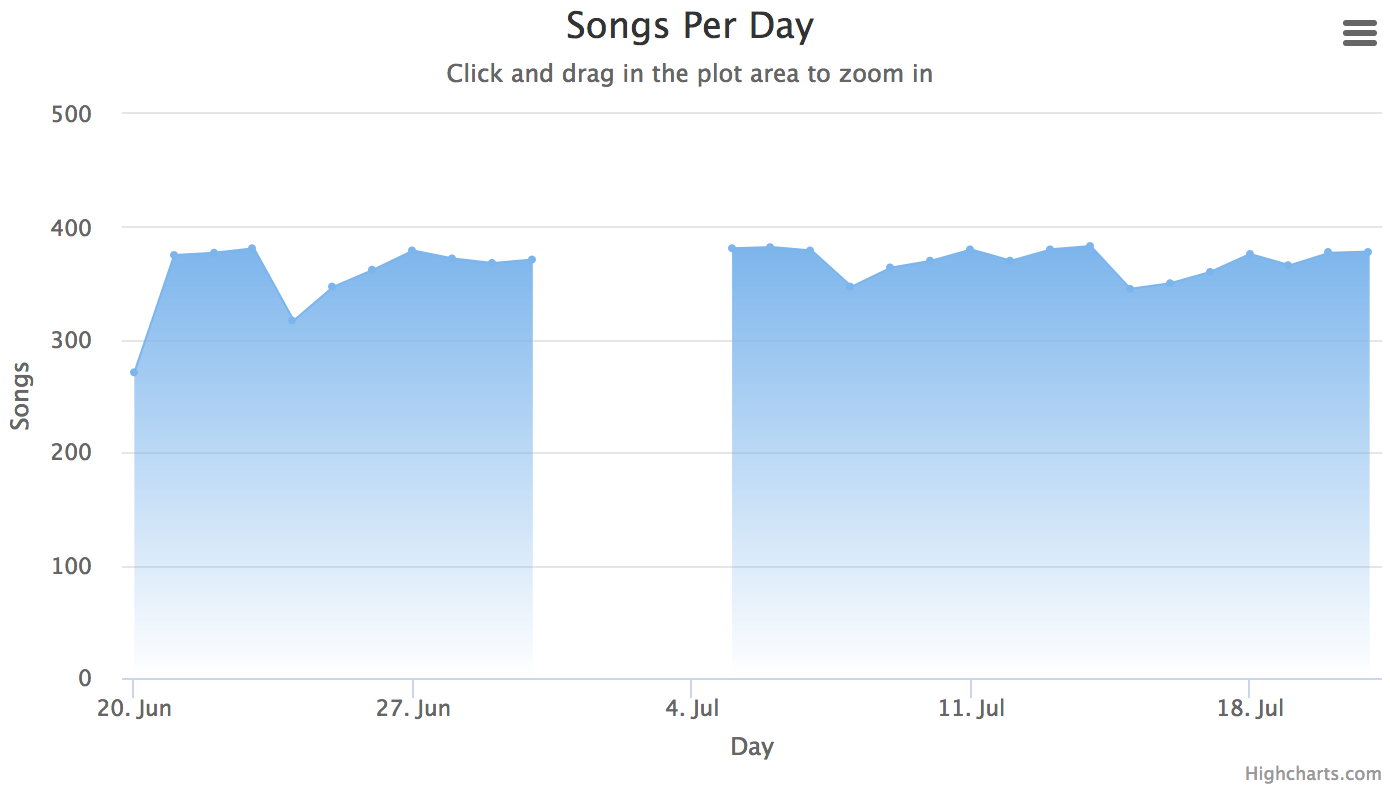
For example, there are four missing days in the following data, and the second chart is our desired outcome.
Find The Missing Data
We begin with our initial DataFrame from the original data. Group by day, and count the number of records per day.
val totalSongsPerDay = allSongsDF.groupBy(year($"startTime").alias("year"), month($"startTime").alias("month"), dayofmonth($"startTime").alias("day"))
  .count()
  .sort("year", "month", "day")
Our totalSongsPerDay DataFrame looks like this:
+----+-----+---+-----+
|year|month|day|count|
+----+-----+---+-----+
|2016|    6| 20|  271|
|2016|    6| 21|  375|
|2016|    6| 22|  377|
...
Create Full Date Range RDD
Next we need to create a list of dates from our oldest data available to the newest. We use joda-time to help us with iterating through all the dates in our range. At the end of this step we will be left with a RDD containing the year, month, day columns we desire as well as a 0 column which we will use in the final step when we join both DataFrames.
def dayIterator(start: LocalDate, end: LocalDate) = Iterator.iterate(start)(_ plusDays 1) takeWhile (_ isBefore end)val emptyDateList = new ListBuffer[Row]()
dayIterator(new LocalDate(startYear, startMonth, startDay), new LocalDate(endYear, endMonth, endDay)).foreach(
  ts => { val row = Row(ts.getYear, ts.getMonthOfYear, ts.getDayOfMonth, 0)
    emptyDateList += row
  }
)
val emptyDateRDD = spark.sparkContext.parallelize(emptyDateList)
[2016,6,20,0]
[2016,6,21,0]
[2016,6,22,0]
...
Convert RDD to DataFrame
The next step is to convert the RDD we produced to a DataFrame so that we can join on it with our original data. We define a schema, and create the DataFrame.
val fieldsSchema = List(
  StructField("eYear", IntegerType, nullable = false),
  StructField("eMonth", IntegerType, nullable = false),
  StructField("eDay", IntegerType, nullable = false),
  StructField("eCount", IntegerType, nullable = false)
)
val emptyDateRange = spark.createDataFrame(emptyDateRDD, StructType(fieldsSchema))
Merge Full Date Range with Original Data
Finally, we merge our generated date ’emptyDateRange’ DataFrame with the original ’totalSongsPerDay’ DataFrame. The resulting DataFrame will contain a column with all the dates and counts, as well as a null in the ‘mergedCount’ column if no data is available for a certain date.
val mergedChartData = emptyDateRange.join(totalSongsPerDay, $"eYear" === $"year" &&
  $"eMonth" === $"month" && $"eDay" === $"day", "left_outer")
  .withColumn("mergedCount", $"eCount" + $"count")
  .sort("eYear", "eMonth", "eDay")
+-----+------+----+------+----+-----+-----+-----+-----------+
|eYear|eMonth|eDay|eCount|year|month| day |count|mergedCount|
+-----+------+----+------+----+-----+-----+-----+-----------+
| 2016| 6| 20| 0|2016| 6| 20| 271| 271|
| 2016| 6| 21| 0|2016| 6| 21| 375| 375|
| 2016| 6| 22| 0|2016| 6| 22| 377| 377|
...
| 2017| 6| 9| 0|null| null| null| null| null|
| 2017| 6| 10| 0|null| null| null| null| null|
| 2017| 6| 11| 0|2017| 6| 11| 182| 182|
...
Conclusion
We can now format this final ‘mergedChartData’ DataFrame in any way we like, and plug it into our graphing library.